Best Data Analytics Course in Surat
Advanced Data Analysis & Visualization
Our data analytics course in Surat teaches you to turn raw business data into decisions: advanced Excel, SQL, Python with Pandas, statistics and exploratory analysis, Power BI data modelling, DAX and interactive dashboards, with AI tools that speed up data cleaning, formulas and reporting. You finish with an end-to-end analytics portfolio project. Classes run at our City Light campus and online.
Why learn data analytics
Every company collects data, but few people can clean it, analyse it and explain what it means. Data analysts are hired by IT companies, banks, e-commerce firms, textile and diamond businesses and startups to build reports, track KPIs and find growth opportunities. It is also one of the most accessible data careers for students from commerce and non-coding backgrounds.
Who this data analyst course is for
- Students after 12th, and B.Com, BBA, BCA and B.Sc students who enjoy working with numbers.
- Working professionals in accounts, sales, operations or MIS who want to automate reports.
- Anyone planning a career in data science who wants a strong analytics foundation first.
What you will learn
- Advanced Excel: XLOOKUP, INDEX/MATCH, pivot tables, what-if analysis, Power Query and AI-generated formulas.
- SQL: joins, grouping, subqueries, CTEs and window functions, with AI help to write and optimise queries.
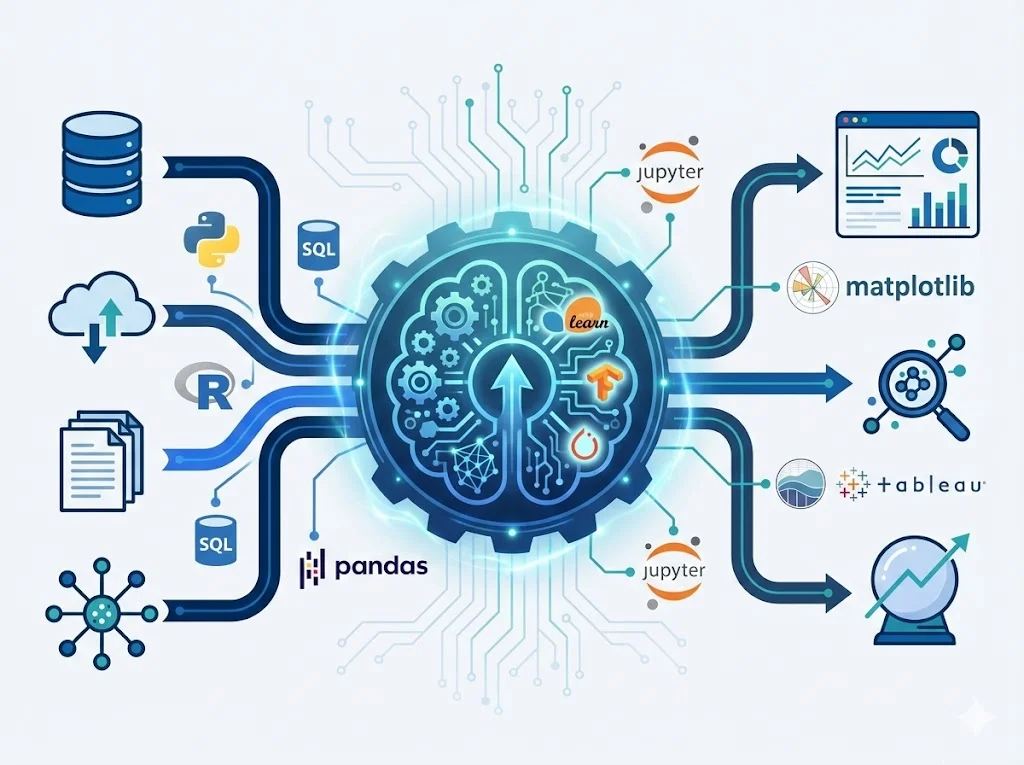
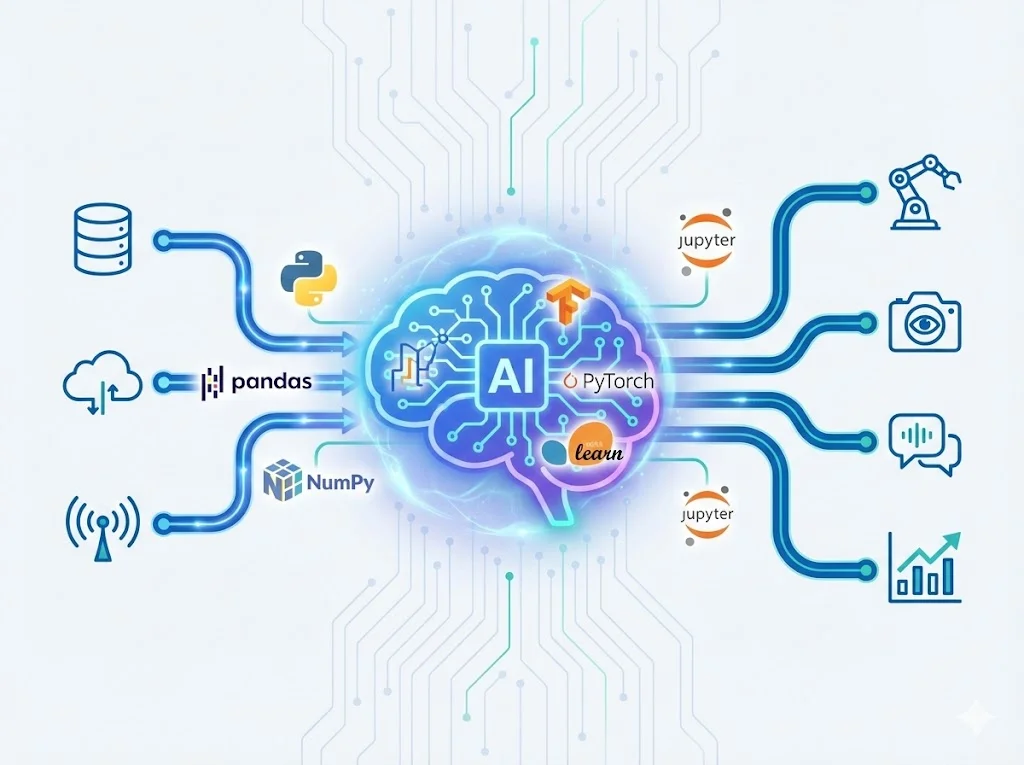
- Python for analysis: Jupyter, Python basics, APIs, and JSON and CSV files.
- Pandas data wrangling: cleaning, merging and reshaping datasets, with AI-assisted scripts.
- Statistics and EDA: averages, variance, outliers and trends, with Matplotlib and Seaborn charts.
- Power BI: data sources, star schema modelling, relationships and the Power Query Editor.
- DAX: measures, filter context, CALCULATE and time intelligence for financial reporting.
- Dashboards: KPI cards, drill-throughs, bookmarks and Power BI AI visuals such as Key Influencers and Q&A.
- Automation: scheduled refreshes, row-level security, Python in Power BI and KPI alerts.
- Capstone and career: a portfolio project, data storytelling and SQL interview practice.
Data analytics course fees and duration
There are two tracks: a basic track of 4-6 months and an advanced track of 9-10 months. The listed fee for the Advanced Data Analysis and Visualization course is ₹50,000. Call +91 95109 90292 to confirm the fee and duration of the track you choose, the next batch date and payment options, or book a free demo class first.
Career after the course
Graduates apply for roles such as Data Analyst, Business Intelligence Analyst, Power BI Developer, MIS Executive and Reporting Analyst. Our placement assistance covers your portfolio, resume and interview preparation.
Related courses
Want to build predictive models next? See the data science course or the AI and machine learning course. New to Python? Start with the Python course. Compare every AI and data programme on our AI courses in Surat page.
Duration: 4-10 Months · Fees: ₹50,000
Course Curriculum
Advanced Excel & Business Logic
- Moving beyond basic spreadsheets: VLOOKUP, XLOOKUP, INDEX/MATCH, and advanced conditional formatting.
- Mastering Pivot Tables and Pivot Charts for rapid data summarization.
- Data validation, What-If Analysis (Goal Seek, Data Tables), and scenario planning.
- Introduction to Power Query in Excel for automated data extraction and transformation.
- Leveraging AI (Excel Copilot and ChatGPT) to generate complex nested formulas instantly.
Relational Databases & Advanced SQL
- Understanding relational database architecture and the role of SQL in enterprise data.
- Writing foundational queries: SELECT, WHERE, GROUP BY, HAVING, and ORDER BY.
- Mastering complex table relationships: INNER JOIN, LEFT JOIN, RIGHT JOIN, and FULL OUTER JOIN.
- Advanced data manipulation: Subqueries, Common Table Expressions (CTEs), and Window Functions (RANK, ROW_NUMBER, LEAD, LAG).
- Using AI to optimize slow-running SQL queries and translate business questions into complex SQL syntax.
Python for Data Analysis Foundations
- Setting up the analytical environment with Jupyter Notebooks and VS Code.
- Python crash course for analysts: Variables, data types, lists, dictionaries, and loops.
- Writing custom functions and understanding Python's error handling.
- Introduction to APIs: Fetching live data (e.g., financial data, weather, social metrics) using the requests library.
- Working with JSON and CSV files programmatically.
AI-Assisted Data Wrangling (Pandas)
- Introduction to the Pandas library: Series and DataFrames.
- Data cleaning at scale: Handling missing values, duplicates, and incorrect data types.
- Merging, concatenating, and reshaping datasets seamlessly.
- Leveraging AI tools (ChatGPT Advanced Data Analysis / Claude) to automate tedious data cleaning scripts.
- Using prompt engineering to instantly generate Pandas code for complex data transformations.
Exploratory Data Analysis (EDA) & Statistics
- Core statistical concepts for business: Mean, median, variance, standard deviation, and percentiles.
- Identifying outliers, anomalies, and seasonal trends in historical data.
- Introduction to Python visualization libraries: Matplotlib and Seaborn.
- Creating histograms, scatter plots, box plots, and heatmaps to uncover hidden correlations.
- Translating statistical findings into plain-English business insights.
Power BI Fundamentals & Data Modeling
- Overview of the Power BI ecosystem (Desktop, Service, and Mobile).
- Connecting Power BI to multiple data sources (SQL databases, Excel, Web, APIs).
- Best practices for data modeling: Building robust Star Schemas (Fact vs. Dimension tables).
- Managing relationships, cross-filter direction, and cardinality (1:1, 1:Many, Many:Many).
- Cleaning and transforming data within Power BI using the Power Query Editor.
Advanced DAX & Business Intelligence
- Introduction to Data Analysis Expressions (DAX) for creating custom calculated columns and measures.
- Understanding row context vs. filter context in Power BI.
- Mastering Time Intelligence functions (YTD, QTD, Same Period Last Year) for financial reporting.
- Using CALCULATE, FILTER, and ALL functions for complex metric calculations.
- Utilizing AI to generate, explain, and troubleshoot complex DAX formulas.
AI-Driven Visualization & Dashboarding
- Designing interactive, high-converting business dashboards in Power BI.
- Choosing the right visual for the right metric (KPI cards, gauge charts, decomposition trees).
- Implementing bookmarks, drill-throughs, and custom tooltips for deep data exploration.
- Using Power BI's built-in AI visuals: Key Influencers, Q&A, and Smart Narrative.
- Integrating AI design agents to create stunning UI layouts and color palettes for enterprise dashboards.
Automating Analytical Workflows
- Moving from manual reporting to automated, scheduled data pipelines.
- Publishing reports to the Power BI Service and configuring scheduled refreshes.
- Setting up row-level security (RLS) to restrict data access based on user roles.
- Using Python scripts directly inside Power BI for advanced data manipulation.
- Alerting stakeholders automatically when KPIs drop below target thresholds.
Capstone Project & Career Placement
- Building a comprehensive, end-to-end analytics portfolio project (e.g., Sales Performance Dashboard, E-commerce Churn Analysis, or Financial KPI Tracker).
- Presenting data stories to non-technical stakeholders effectively.
- Tailoring your resume and LinkedIn profile for Data Analyst and BI Developer roles.
- Technical interview prep: Live SQL tests, take-home data challenges, and business case studies.
- Strategies for landing high-paying analytics roles in Surat and across India's remote tech sector.
Why Choose Extrabits for Advanced Data Analysis & Visualization Training?
At Extrabits Academy, we provide the best Data Analytics Course in Surat, offering more than just theory - we provide an opportunity to enhance your career with practical knowledge and live project experience.
Gain insights from professionals with years of real-world experience.
Work on live projects and build a portfolio that stands out.
Choose from weekend or weekday batches to suit your schedule.
Master core concepts and advanced techniques in modern technology.
Apply your skills to solve real business problems through case studies.
Earn a recognized certificate to boost your career opportunities.
Student Reviews
Rated 4.9/5 ★ from 109 Google reviews

Google review · Jan 2026
★★★★★
"I did a python data analysis course and it was wonderful"
Google review · Jun 2026
★★★★★
"One of the best institutes for learning computer programming languages. The teaching methods are clear, practical, and easy to understand. The instructors are knowledgeable, supportive, and always willing to help with doubts. The focus on hands-on practice and real-world examples makes learning enjoyable and effective. I highly recommend this institute to anyone who wants to build a strong..."
Google review · Jul 2026
★★★★★
"ExtraBits Academy is an excellent place to learn computer programming. The instructors explain concepts clearly and make even difficult programming languages easy to understand. The curriculum is well-structured, with a good balance of theory and hands-on practice. The supportive learning environment and practical projects helped me improve my coding skills and confidence. I highly recommend..."
FAQs about the Data Analytics Course in Surat
What is the fee for the data analytics course in Surat?
The listed fee for the Advanced Data Analysis and Visualization course at ExtraBits Academy is ₹50,000. Call +91 95109 90292 to confirm the fee and duration of the basic or advanced track.
How long is the data analyst course?
There is a basic track of 4-6 months and an advanced track of 9-10 months. Our counsellors help you choose based on your background and goals.
Can commerce or non-IT students learn data analytics?
Yes. The course starts with Excel and SQL, which suit commerce and business students, and teaches Python and statistics from the basics. No coding experience is needed to begin.
Do you teach Power BI and SQL?
Yes. You learn SQL from basic queries to window functions, and Power BI from data modelling and DAX to interactive dashboards, scheduled refreshes and row-level security.
How is AI used in the course?
You use tools such as ChatGPT, Claude and Excel Copilot to generate formulas, write and optimise SQL, automate Pandas cleaning scripts and explain DAX, and you use Power BI's built-in AI visuals.
What jobs can I get after data analytics training?
Data Analyst, BI Analyst, Power BI Developer, MIS Executive and Reporting Analyst roles. Our placement assistance helps with your portfolio project, resume and interviews.
Where are the data analytics classes held?
At our campus on the 3rd floor of Agrasen Shopping Point, City Light Road, Athwa, Surat 395007. Online batches are also available across Surat.
Explore Related Courses
Expand your skillset with these related technology courses.